CAT Percentile Explained for 2026
SEO promise: Understand CAT percentile as a rank-based measure, why it differs from marks, and why score tables must be treated as year-specific estimates.
Evidence note: Refresh CAT notification details from the official IIM CAT site during the annual update pass. Where this draft uses CAT 2025 or institute criteria, it says so directly. All worked examples in this guide are illustrative and labelled as such — they are not official CAT scaling constants.
CAT percentile is not the percentage of questions you got right. It is a position in the candidate pool. Two students with the same raw marks in different years can land at different percentiles, and one student's overall percentile can look strong while a sectional percentile blocks an institute shortlist. This guide explains the rank-based definition, walks through the normalization process, shows a sectional-cutoff failure with the IIM Ahmedabad PGP 2026-28 criteria, and ends with a seven-question checklist for any score-percentile table you find online.
Percentile means rank — not marks, not accuracy
Takeaway: A percentile tells you where you stand relative to other test-takers, not how many marks you scored.
A percentile is a position statistic. If candidates take the same exam and your rank by scaled score is , your percentile is approximately:
A percentile of 95 means roughly 5 percent of the pool scored higher than you on the scaled scale. It says nothing about the percentage of questions you got right. A student who answered 35 percent of the paper in a hard year can land above a student who answered 45 percent in a softer year, because rank is calculated against the pool, not the paper [1], [9].
Three implications. A fixed raw target is not a fixed percentile target — the pool shifts every year. Small raw differences near the top of the distribution translate into large percentile differences, because the top is densely packed. And sectional and overall percentiles are computed against the same pool on different rank lists, so a strong overall rank does not protect a weak sectional rank.
The official CAT scorecard publishes scaled scores and percentiles for each section and the overall paper [1]. The next section walks through how the scaled score is produced — that is the step where slot-difficulty differences are removed before ranking.
Section anchor: candidates and rank .
How CAT normalization actually works
Takeaway: Normalization removes slot-difficulty differences before percentiles are computed, so two students of equal ability writing different slots are placed on the same scale.

CAT is conducted in two or three slots on the same day, with different question papers in each slot. Without adjustment, a candidate who happened to write a harder slot would be penalised for the paper they were assigned. The IIM normalization process is designed to remove this slot-difficulty effect before any percentile is assigned [1], [9].
The official process, documented by the organising IIM and summarised in published analyses, has four conceptual stages [9]:
- Raw score. Marks earned in the slot, applying the standard +3 correct, incorrect MCQ, and 0 for unattempted or non-MCQ items.
- Scaled score within slot. Raw scores are transformed using the slot-level distribution — slot mean, slot standard deviation, and the mean raw of the top 0.1 percent per slot [9]. The transformation is of the form , with calibration constants and derived from the slot statistics. The methodology is published; the exact and for any given year are not.
- Equi-percentile mapping across slots. Two raw scores from two different slots are treated as equivalent if they correspond to the same percentile within each slot. A raw of 78 at the 95th percentile of Slot 1 and a raw of 82 at the 95th percentile of Slot 2 map to the same scaled score on the common scale [9]. See equi-percentile.
- Percentile rank on scaled scores. Candidates are ranked on the common scale, and percentile is computed as , where is the rank by scaled score and is the total candidate pool [1].
The same four-stage process runs separately for each section — VARC, DILR, QA — and for the composite paper. That is why the scorecard carries four percentile numbers and four scaled scores, and why sectional percentiles cannot be derived from the overall percentile by arithmetic.
Two flags. IIM publishes the methodology but not the slot-level constants for any given year, so no third party can reconstruct exact scaled scores from raw — every score calculator is a calibration estimate built on past patterns [4], [5], [9]. And the equi-percentile method equalises across slots within a year, not across years; comparing a CAT 2025 scaled score to a CAT 2023 scaled score is not meaningful. See scaled score and normalization.
Section anchor: four-stage scaling.
Worked normalization example — two slots, same student
Takeaway: Equi-percentile mapping lines up equal-ability candidates across slots, even when their raw scores look different.
This example is illustrative. The numbers are constructed to show the mechanics of equi-percentile mapping. The exact slot-level constants used by IIM are not published, so the scaled scores below are not official CAT scaling constants and should not be quoted as such.
Aanya writes Slot 1, the harder paper of the day. Rohan writes Slot 2, the softer one. Both have the same underlying ability; they differ only in slot assignment. Illustrative slot statistics and outcomes:
| Metric (illustrative) | Slot 1 (harder) | Slot 2 (softer) |
|---|---|---|
| Mean raw score across slot | 45 | 49 |
| Standard deviation of raw | 18 | 19 |
| Mean raw of top 0.1 percent | 110 | 116 |
| Candidate raw score | 78 (Aanya) | 82 (Rohan) |
| Within-slot percentile | 95.0 | 95.0 |
| Scaled score (illustrative) | ||
| Overall percentile after ranking |
Both sit at the 95th percentile of their own slot — that is what "same ability" looks like once paper difficulty is stripped out. The equi-percentile step maps both raw scores to the same point () on the common scale, and both end up at roughly the same overall percentile.
Two takeaways. The four-mark gap in raw scores disappears in the scaled output because that gap was a property of the paper, not of the candidates. And the 95 here is itself a function of the full distribution on the common scale, not a property of "78 marks worth of questions correct."
If Aanya had written Slot 2, she would have scored close to Rohan's 82, because the softer paper yields more marks for the same skill. This is the unfairness equi-percentile is built to remove, and the reason a raw in isolation gives an incomplete picture of percentile until slot statistics are released [1], [9].
The table uses a linear scaling sketch for clarity. Actual CAT scaling is non-linear at the tails of the distribution, so small raw differences near the very top of a slot can produce larger scaled differences than the linear approximation suggests [9]. Mental model, not calculator.
Section anchor: two slots, same ability.
Why marks shift — four moving parts
Takeaway: Marks-to-percentile conversion changes because the exam and pool both change between years.
Four moving parts shift marks-to-percentile by several percentile points in either direction.
- Paper difficulty. A harder paper compresses the distribution, so the raw mark required for a given percentile drops. A raw of 75 might map to 99 in a hard year and to 96 in a softer year [4], [5].
- Slot normalization. Even within one year, the slot you write affects the raw-to-scaled mapping. Equi-percentile adjusts for this, but your raw alone is not enough to estimate percentile until slot statistics are known [9].
- Candidate pool. Around three lakh candidates appear each year. The composition — engineer share, fresher share, repeat-taker share — shifts marginally year on year, and a stronger pool means more candidates compete for the same top percentile slots [3].
- Section balance. A balanced 75-25-25 across VARC, DILR, QA produces a higher overall percentile than a lopsided 80-15-30 at the same total, because overall ranking is on the composite scaled score and lopsided scorecards lose more to scaling.
Coaching calculators are useful for approximate calibration after the paper is released; none should be quoted as official CAT thresholds [4], [5], [6], [7]. Use them as ranges, not point estimates.
Section anchor: four moving parts.
Overall percentile vs sectional percentile — both matter

Takeaway: A high overall percentile does not remove sectional cutoff risk — sectional thresholds are checked independently.
Institutes apply two gates. The first is overall percentile. The second is per-section percentile, with each section checked independently against its own threshold. Both gates must be cleared before the candidate enters the next shortlisting stage. The IIM Ahmedabad PGP 2026-28 selection criteria for Indian candidates publish these thresholds explicitly [2]:
| Category (Non-PwD) | Overall percentile | VARC sectional | DILR sectional | QA sectional |
|---|---|---|---|---|
| General / EWS | 95 | 85 | 85 | 85 |
| NC-OBC | 90 | 80 | 80 | 80 |
| SC | 85 | 75 | 75 | 75 |
| ST | 75 | 65 | 65 | 65 |
All candidates must additionally post a "positive (greater than zero) raw score in all sections" to proceed [2]. PwD candidates follow lower thresholds — Overall 85 / Sectional 75 for General-EWS, scaling down by category [2]. Transgender candidates in the General category follow NC-OBC cutoffs [2]. See IIM Ahmedabad cutoff for the full breakdown including the application rating model that follows the preliminary screen.
Each IIM wants both range (overall percentile, a proxy for aptitude across the paper) and balance (sectional percentile, a proxy for not being unable to function in one section). A candidate brilliant at QA and uninterested in VARC fails the second gate. A uniformly strong candidate clears both gates with a lower peak.
This is the failure mode the next section makes concrete with two candidate profiles.
Section anchor: two percentile layers.
Sectional vs overall — worked example with IIM Ahmedabad 2026-28 criteria
Takeaway: A lopsided 98 OA is filtered out by the sectional gate; a balanced 96 OA clears it.
Two profiles. Both are General category candidates. Both target IIM Ahmedabad for the PGP 2026-28 admission cycle. The IIM-A preliminary screening cutoffs for the General category are Overall percentile 95, with VARC, DILR, and QA sectional percentiles of 85 each [2].
Two profile comparisons against the IIM-A General gates:
| Profile | VARC | DILR | QA | Overall | Result |
|---|---|---|---|---|---|
| A — high peak, weak VARC | 70 | 99 | 99 | 98 | Filtered (VARC 70 85) |
| B — balanced, lower peak | 87 | 86 | 92 | 96 | Clears all four gates |
Profile A clears overall (98 95), DILR (99 85), and QA (99 85), but fails VARC (70 85) [2]. Sectional thresholds are applied independently, so this candidate is filtered out at preliminary screening. Strong DILR and QA do not compensate for the VARC gap.
Profile B clears overall (96 95), VARC (87 85), DILR (86 85), and QA (92 85). All four gates pass, and the candidate proceeds to IIM-A application rating — despite the lower overall.
The lesson is not that 96 is better than 98 — Profile A may have a higher conversion probability than Profile B at institutes that weight overall percentile more heavily with softer sectional cutoffs. The lesson is that IIM Ahmedabad's published criteria are sectional-gated, so a repair plan for Profile A has to lift VARC by at least 15 percentile points, not push DILR and QA from 99 to 99.5 [2]. Most lopsided scorecards face this same arithmetic.
IIM-A's category thresholds have shifted across admission cycles; the numbers above are from the published PGP 2026-28 criteria [2]. Always pull current-year thresholds from the institute's own admissions page — coaching summaries can lag the official update by weeks.
Section anchor: sectional gate filters lopsided scores.
Percentile bands and what they actually open
Takeaway: Overall percentile opens interview calls; final admission depends on application rating, GD/PI performance, and the institute's composite score formula.
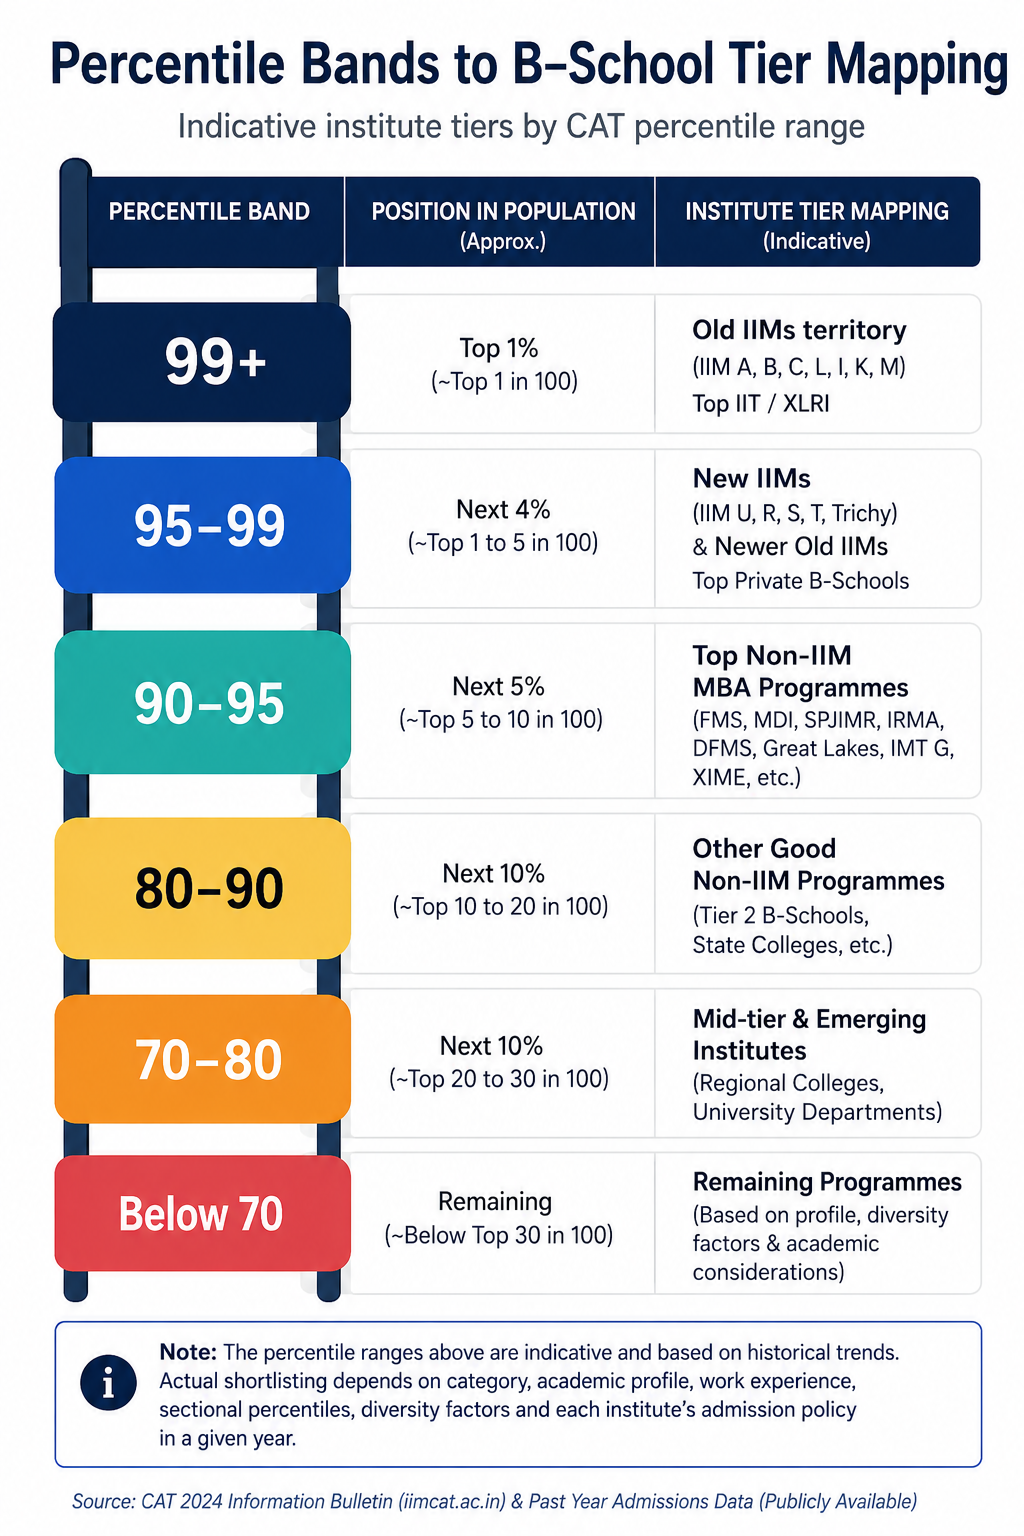
A pragmatic mapping of overall percentile bands to the B-school tiers they typically open at the interview-call stage. These are ranges, not commitments, and they describe interview eligibility, not admission outcomes. The numbers shift year on year and vary by category, application-rating model, and sectional balance [2], [8].
- 99+ overall. IIM Ahmedabad, Bangalore, and Calcutta interview candidates, conditional on sectional clearance. Older IIMs at Lucknow, Indore, and Kozhikode pull from this band and from the high-98s. At this range, the gating factor is almost always sectional balance and academic profile, not overall percentile.
- 97 to 99 overall. The newer IIMs (Trichy, Ranchi, Raipur, Rohtak, Kashipur, Udaipur, Sambalpur, Amritsar, Bodh Gaya, Jammu, Sirmaur, Visakhapatnam, Nagpur, Mumbai) interview from this band, along with FMS Delhi for stronger profiles. SP Jain PGPM and MDI Gurgaon also begin to pull from here.
- 90 to 97 overall. MDI Gurgaon, NMIMS Mumbai, SP Jain PGPM, and IIFT (its own exam is more common, but CAT remains relevant for some intakes). Strong tier-1 private B-schools and select IIMs at the lower end of their range.
- 85 to 90 overall. Tier-2 candidates — TAPMI, Great Lakes, IMI Delhi, IMT Ghaziabad — and waitlist territory for select newer-IIM seats.
Two heavy caveats. These are interview-call thresholds, not final-conversion thresholds. Final admission at every IIM and most peer institutes is decided by a composite score that weights CAT percentile alongside class 10, class 12, graduation marks, gender diversity, academic diversity, work experience, and GD/PI performance [2]. The exact weights are published per institute and per cycle — see composite score. And conversion at the IIMs from the interview pool is typically 1 in 4 to 1 in 8 depending on institute and year; clearing the interview gate is necessary, not sufficient.
Plan your CAT target as a percentile band ("aim for the 98+ band"), not a marks figure, and pair it with a section-balance target. A candidate with a 99 overall and an inconsistent profile can convert fewer interviews than a 97 overall with a clean academic record. See IIM Ahmedabad cutoff for the application-rating breakdown that runs after the preliminary screen.
Section anchor: interview-call bands, not conversion bands.
How to read score tables — use bands and dates
Takeaway: A score table without a year, source, and scale label is not reliable enough to plan around.
Every score-percentile table you encounter online should name the year, the source, and whether the values are raw marks, scaled scores, or predicted scaled scores. If a table blends CAT 2023, 2024, and 2025 estimates without labels, it creates false precision and over-states what the calibration can actually claim [4], [5], [6], [7].
| Label required | Why it matters | Example |
|---|---|---|
| Year | Paper difficulty and pool composition shift year on year | "CAT 2025 estimate" |
| Score type | Raw and scaled differ by 10 to 20 points in either direction | "Scaled score" |
| Source | Official scorecards differ from coaching-derived estimates | "2IIM calibration, post-CAT 2025" |
| Date checked | Coaching pages update their estimates as the result cycle progresses | "Checked 2026-06-15" |
A score-vs-percentile table is most useful as a calibration range — "scaled 70-75 mapped to overall 95-97 in CAT 2024 estimates" — and misleading as a point estimate. Use it to set the order-of-magnitude target for your mock-test plan, and replace it with official scorecard data after results.
Section anchor: four labels on every table.
Score-table caveats — seven questions before you trust a chart
Takeaway: A short checklist that exposes most score-percentile tables circulating on coaching pages and forum threads.
Before a score-percentile table influences your study plan, ask these seven questions. If the table or its source does not answer at least five of them clearly, treat the numbers as anecdotal.
- Year? CAT 2023, 2024, 2025, or a multi-year blend? A blend is fine for trend-spotting, weak for target-setting.
- Source? Official IIM scorecard data, a coaching calculator (2IIM, Cracku, Career Launcher, MBAUniverse), a survey of declared scorers, or a forum aggregate [4], [5], [6], [7]?
- Slot? Slot 1, Slot 2, Slot 3, or post-normalization composite? Pre-normalization slot tables are interesting, not actionable.
- Raw or scaled? Raw () and scaled differ by 10 to 20 points in either direction near the top of the distribution.
- Sample size? A calibration on 50,000 reported scorecards is far stronger than one on 500 forum posts.
- Methodology? Direct scorecard scraping, statistical fitting against published cutoffs, or a model trained on prior years and extrapolated forward?
- Last updated? Coaching estimates evolve in the weeks after CAT day. A table dated three weeks post-CAT is more reliable than one published on result-eve.
A table that answers six or seven of these is a working calibration tool. A table that answers fewer than three is shareable infographic content. The difference matters when you are deciding whether to push a sectional from 88 to 92.
Section anchor: seven trust questions.
FAQs
Is CAT percentile the same as percentage?
No. Percentage is marks out of total. Percentile is rank relative to other candidates in the same year's pool. A 95 percentile means roughly 5 percent of the pool scored above you on the scaled scale, regardless of what fraction of questions you answered correctly [1].
Can I convert CAT marks to percentile exactly?
Not before official results. Coaching calculators give year-specific estimates calibrated against past data, but exact mapping requires the slot statistics IIM publishes only with the result [4], [5], [9]. Use estimates as bands, not point predictions.
Does overall percentile matter more than sectional percentile?
Both matter, and they are checked independently. IIM Ahmedabad's PGP 2026-28 criteria apply an Overall percentile cutoff and a separate sectional cutoff for VARC, DILR, and QA — a candidate must clear all four to enter the next shortlisting stage [2]. Most peer institutes follow the same two-gate structure.
Why did my percentile drop with the same marks?
Three reasons. Paper difficulty: a softer paper compresses the top, so the marks needed for a given percentile rise. Slot normalization: your raw maps to a scaled score using your slot's distribution, which moves year on year. Pool composition: a stronger pool of test-takers pushes percentiles down slightly for the same raw [3], [9].
How is CAT percentile calculated to two decimal places?
The formula is , where is the rank by scaled score and is the total candidate count for that section or the overall paper. With around three lakh candidates, the rank-based formula naturally supports two-decimal resolution. The scorecard reports percentile to two decimals for each section and the overall [1].
Can I check the normalization formula CAT uses?
The methodology is published — slot mean, slot standard deviation, mean raw of the top 0.1 percent per slot, equi-percentile mapping across slots, percentile ranking on the common scale [9]. The calibration constants ( and in ) are not published for any year. Third-party tools can reproduce the methodology, not the exact scaled score from a raw alone.
What is the difference between OA and FCS for IIM admissions?
OA is overall CAT percentile, computed on the scaled composite. FCS is final composite score — the institute-specific weighted formula that combines CAT percentile, class 10 and 12 marks, graduation marks, work experience, GD/PI performance, gender diversity, and academic diversity to produce the admission rank [2]. OA opens the interview call. FCS decides the admit. See composite score.
Conclusion
After your next mock, write three numbers in this order: overall percentile estimate, weakest sectional percentile estimate, net score. The weakest sectional number decides the next seven days of repair, because it is the gate most likely to filter you out of the shortlist before the application rating step even begins.
References
[1] Indian Institutes of Management, "CAT official website," 2025. [Online]. Available: https://iimcat.ac.in/. Accessed: Jun. 15, 2026.
[2] Indian Institute of Management Ahmedabad, "Admission - MBA: Indian candidates, PGP 2026-28 selection criteria," 2025. [Online]. Available: https://www.iima.ac.in/academics/mba/admissions/indians. Accessed: Jun. 15, 2026.
[3] Times of India Education, "CAT 2025 result reporting and candidate pool," 2025. [Online]. Available: https://timesofindia.indiatimes.com/education/news. Accessed: Jun. 15, 2026.
[4] 2IIM, "CAT score calculator and score-vs-percentile estimates," 2025. [Online]. Available: https://online.2iim.com/CAT-score-calculator/. Accessed: Jun. 15, 2026.
[5] Cracku, "CAT score calculator," 2025. [Online]. Available: https://cracku.in/cat-score-calculator/. Accessed: Jun. 15, 2026.
[6] Career Launcher, "CAT marks vs percentile," 2025. [Online]. Available: https://www.careerlauncher.com/cat-mba/cat-marks-vs-percentile/. Accessed: Jun. 15, 2026.
[7] MBAUniverse, "CAT score vs percentile analysis," 2025. [Online]. Available: https://www.mbauniverse.com/articles/cat-score-vs-percentile. Accessed: Jun. 15, 2026.
[8] InsideIIM, "CAT preparation and admission analysis," 2025. [Online]. Available: https://insideiim.com/. Accessed: Jun. 15, 2026.
[9] Careers360, "CAT normalization process and scaled score guide," 2025. [Online]. Available: https://bschool.careers360.com/articles/cat-normalization-process. Accessed: Jun. 15, 2026.
[10] 2IIM, "CAT previous-year question papers," 2025. [Online]. Available: https://online.2iim.com/CAT-question-paper/. Accessed: Jun. 15, 2026.
Related reading
Sectional cutoff in CAT: what each IIM requires
Why mock percentile is not your final CAT percentile
Use a three-mock variance band to read CAT mock percentile without overreacting to one test.
IIM cutoffs and shortlist criteria, explained
Complete VARC Strategy for CAT 2026
Build a 40-minute VARC plan for CAT 2026 with passage selection, RC accuracy protocols, VA sequencing, and a 56-day drill plan.
CAT Composite Score Explained for 2026
Understand how IIMs combine CAT score with profile factors, using IIM Ahmedabad’s official shortlist formula as the worked example.